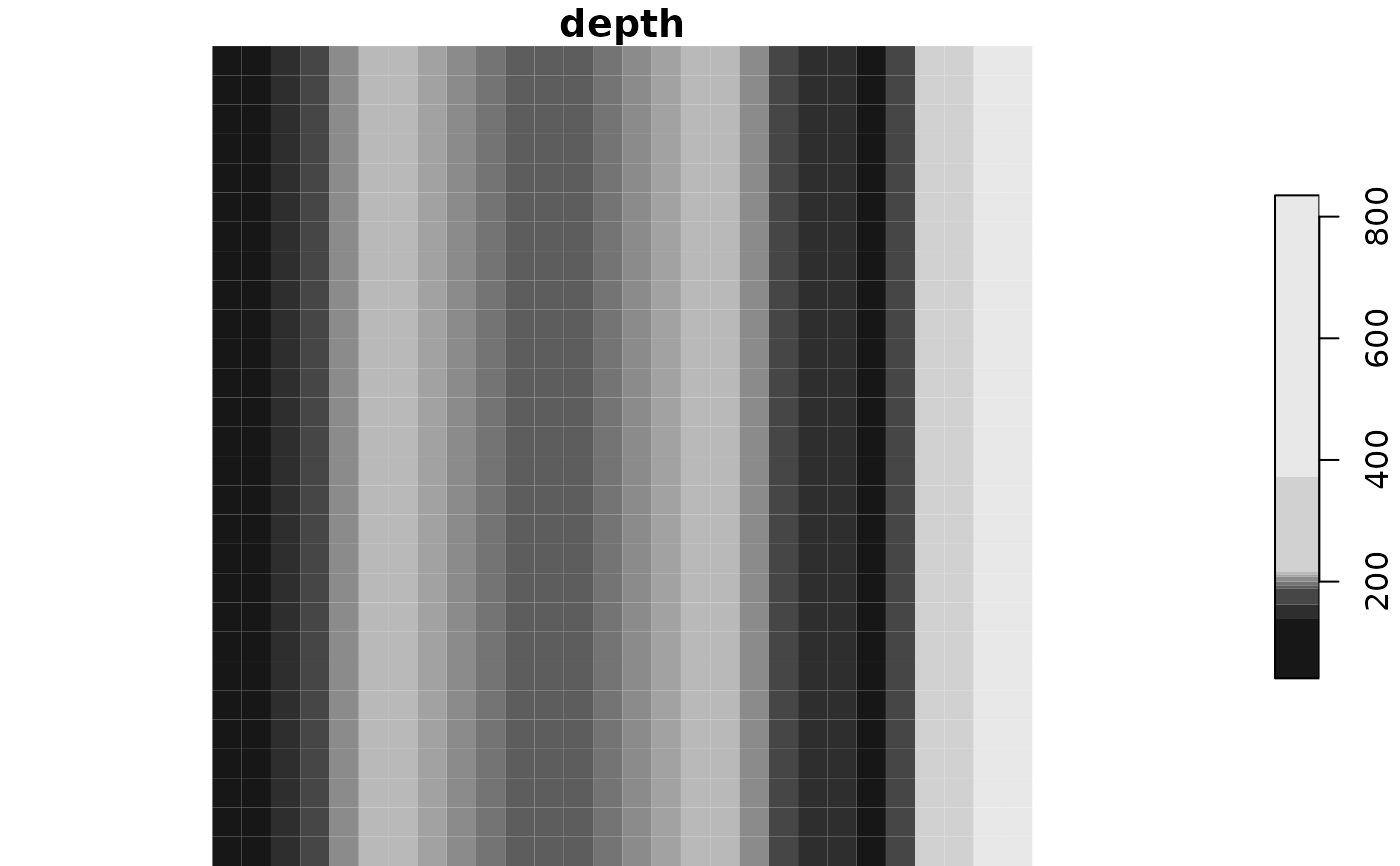
This function sets up a depth-stratified survey grid. A simple gradient in depth
is simulated using stats::spline() (default), with a shallow portion, shelf, and
deep portion. Optionally, covariance can be added to the depth simulation.
Arguments
- x_range
Range (min x, max x) in the x dimension (km).
- y_range
Range (min y, max y) in the y dimension (km).
- res
Resolution of the grid cells (km).
- shelf_depth
Approximate depth of the shelf (m).
- shelf_width
Approximate width of the shelf (km).
- depth_range
Range (min depth, max depth) of the depth values (m).
- n_div
Number of divisions to include.
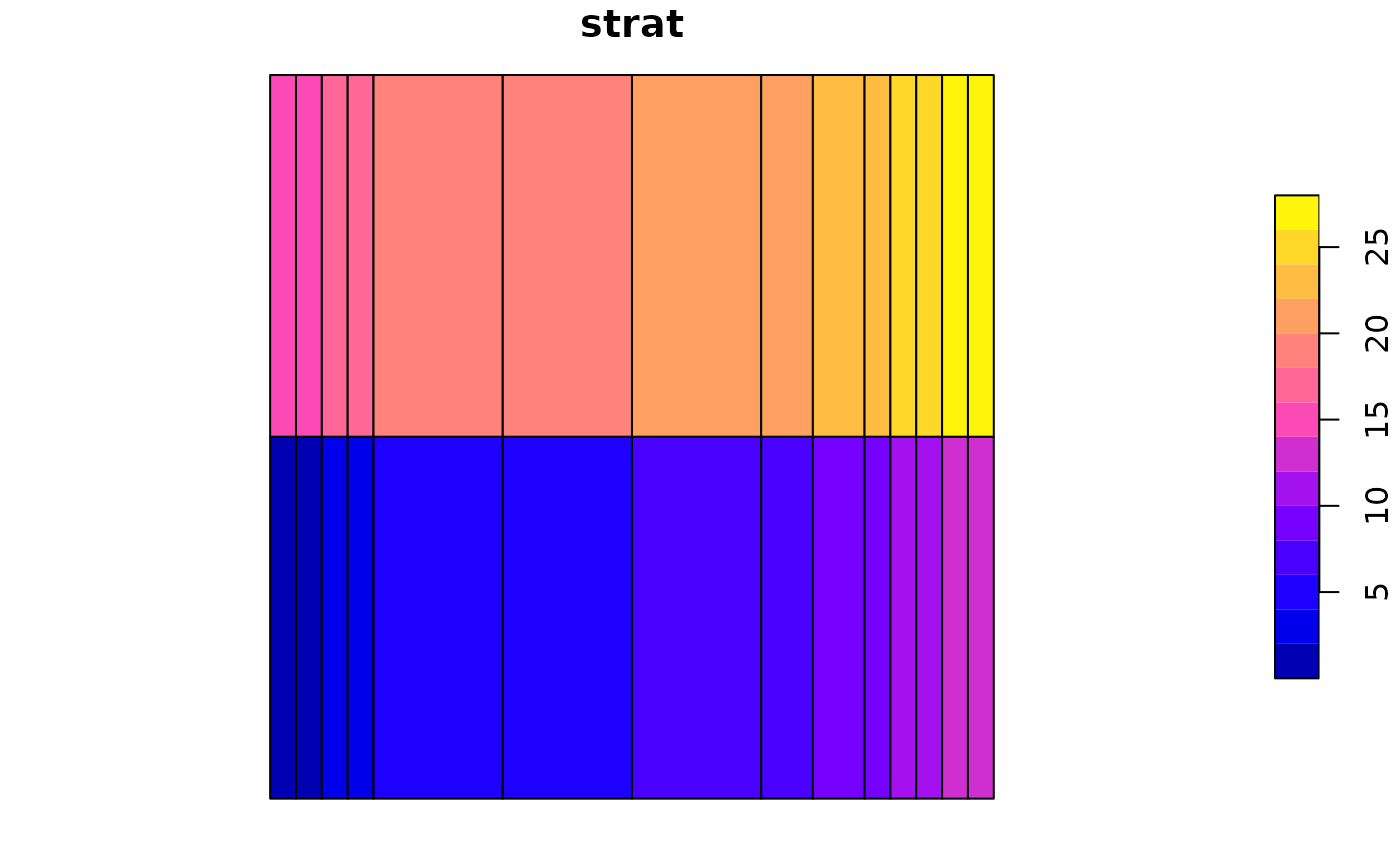
- strat_breaks
Depth breaks used to define strata.
- strat_splits
Number of times to horizontally split strata (i.e., a way to increase the number of strata).
- method
Choose
"spline","loess", or"bezier"to generate a smooth gradient, or use"linear"for linear interpolation.
Value
A stars object with 2 dimensions (x and y) and 4 attributes (depth, cell, division, strat).